On a per-student basis, staffing levels hit an all-time high.
These numbers are in full-time equivalents (FTEs), which are adjusted based on the number of hours worked by part-time staff. The FTE numbers are a better measure of total staff time available, but the raw headcount numbers come out faster, and those suggest schools may be in for another new high in 2023-24.
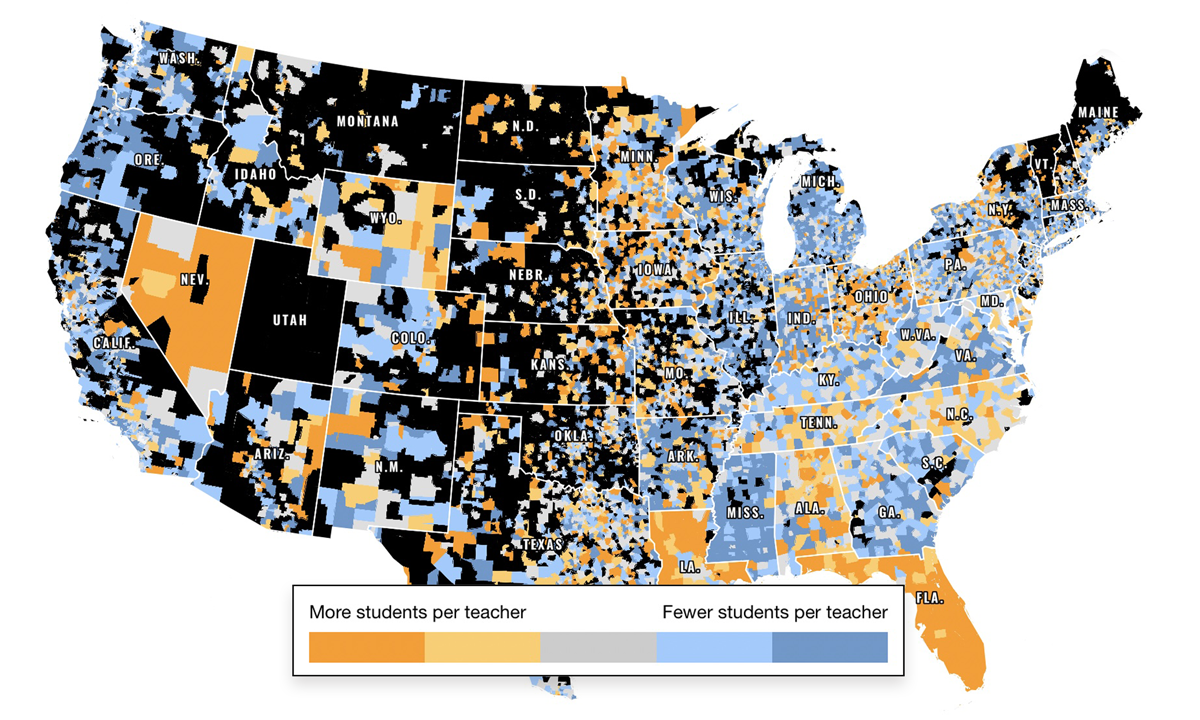
The outlook beyond that looks murkier. As districts spend down the last of their federal ESSER dollars, they may have to lay off staff or close under-enrolled buildings. To identify which communities are most at risk, I worked with Eamonn Fitzmaurice, The 74’s art and technology director, to update our data on how student-to-teacher ratios are changing across the country. Click on the map below to see the results in your community.
▼
Teacher Staffing
Student Enrollment
+50%
+25%
0%
-25%
-50%
2016/17 17/18 18/19 19/20 20/21 21/22 22/23
More students per teacher
Fewer students per teacher
Reset Map
After screening out very small districts and those without sufficient data (marked in black), we examined staffing and enrollment trends for 9,500 districts, comprising 92% of all students nationwide. We then compared the teacher and student counts from 2022-23 — the most recent available — with the same figures for 2016-17.
About one-quarter of districts had fewer teachers per student last year than they did six years earlier. Those are shaded in orange or yellow. Districts in Nevada, Alaska, Louisiana and especially Florida are predominantly orange on the map, meaning they have higher student-to-teacher ratios than they did before the pandemic.
With More Teachers & Fewer Students, Districts Are Set up for Financial Trouble
But many more districts are shaded blue or gray, meaning they serve fewer — or a lot fewer — students per teacher than they did six years earlier. Overall, nearly three-quarters of districts fell into one of these categories.
Nearly one-third of districts added teachers while serving fewer students. For example, Philadelphia lost nearly 16,000 students but employed 200 more teachers, effectively dropping its student-to-teacher ratio from about 17:1 to under 15:1.
About one-quarter of districts followed the path of Capistrano Unified School District in California. Even with some hiring spurts, it shrunk its teacher count somewhat over time, but not as fast as it lost students. In numeric terms, Capistrano suffered a 22% decline in student enrollment but cut its teaching staff by just 7%.
Another group of districts have growing enrollments, but their teacher counts are rising even faster. Take the Katy Independent School District, near Houston, as an example. It added 4,299 students last year, a gain of 4.9%. But at the same time, it hired 366 teachers, a 6% gain. Over the entire period, its student body has grown 22% while its teacher count grew 29%.
The district-level numbers in the map focused on classroom teachers, who make up a little under half of all school district employees. But staffing levels have increased for many types of roles. The table below shows the one-year and six-year changes in total staffing counts and student enrollments, sorted by role from biggest to smallest.
Over the last year, the only category of workers that grew more slowly than student enrollment was school administrative support staff. Zooming out further, librarians and media support staff are down from their pre-pandemic levels, as is a large category called “all other support staff” that includes plant and equipment maintenance employees, bus drivers, security and food service workers. But otherwise, staffing levels are up. The numbers of paraprofessionals; student support staff (including attendance officers and providers of health, speech pathology, audiology or social services); district administrative support staff; guidance counselors; instructional coordinators; and district administrators have all increased by double digits.
In other words, the national trend is for schools to have more staff, in many different roles, than they did before the pandemic. To be sure, all these additional staffers may have contributed to the better-than-average student achievement gains last year. But as a purely budgetary matter, time will tell if schools are able to retain all those workers, or if they’ll need to make painful adjustments in the year to come.
